
Do AI-Powered Stock Signals Actually Work?
Retail traders have always been at an information disadvantage. Institutional desks run multi-million dollar quant models, employ full-time analysts, and process news feeds faster than any individual can read a headline. AI-powered stock signals promised to close that gap. But between the hype an...
- #Stock Signals
Retail traders have always been at an information disadvantage. Institutional desks run multi-million dollar quant models, employ full-time analysts, and process news feeds faster than any individual can read a headline. AI-powered stock signals promised to close that gap. But between the hype and the reality, a fair question deserves a fair answer: do they actually work? The short answer is that it depends heavily on how they are built, what they tell you, and whether they give you enough context to act on them responsibly. This post breaks down the real benefits and risks, and shows how Zentrix.ai is approaching this with a signals dashboard designed for transparency first.
Key Takeaways
- AI signals can process far more data than any individual trader, but they are not infallible and require human judgment to use well.
- The biggest risk with most signal tools is opacity: a signal without context, win rates, or risk parameters is not actionable intelligence.
- Backtested win rates matter, but live performance data is the true measure of a signal’s value.
- Zentrix.ai’s Breakout V1 signals dashboard shows both live and backtested outcomes side by side, so you always know what you are working with.
- Transparent risk metrics, including stop loss levels and take-profit targets, transform a signal from a hunch into a structured trade idea.
Why Traders Are Turning to AI Signals
The case for AI-assisted trading signals is grounded in scale. Markets generate an enormous volume of data every second, from price action and volume patterns to options flow and broader macro inputs. A McKinsey Global Institute report found that AI adoption in financial services has accelerated faster than in almost any other sector, largely because the data density is so high that human analysis alone cannot keep pace.
For retail traders specifically, this matters because pattern recognition across multiple timeframes is both time-consuming and cognitively demanding. Missing a breakout on the 5-minute chart because you were watching the wrong ticker is a common frustration. AI models can monitor dozens of symbols simultaneously, flag setups based on defined criteria, and surface them before the move is over.
Beyond speed, there is a consistency argument. Human traders are susceptible to fatigue, confirmation bias, and emotional decision-making, especially after a string of losses. A well-designed signal engine does not get discouraged. It applies the same logic on a Monday morning as it does after a volatile Friday selloff.
According to J.P. Morgan’s market structure research, approximately 70% of daily US equity volume is now driven by algorithmic or quantitative strategies. Retail traders who ignore systematic tools are increasingly competing without the same infrastructure.
The Real Risks You Need to Understand
The benefits are real, but so are the pitfalls. The retail signal market is cluttered with services that show cherry-picked winning trades, hide losing periods, and present backtested results as though they represent live performance. These two numbers are rarely the same, and the gap between them often tells you more than either figure alone.
Overfitting and Curve-Fitting
Many AI models are trained on historical data in a way that makes them look exceptional in backtests but fall apart in live conditions. This is called overfitting: the model has memorized the past rather than learned transferable patterns. When market conditions shift, an overfitted model tends to generate false signals at a higher rate than its backtest suggests.
Signals Without Context
A signal that tells you “go long TSLA” is almost useless without knowing the stop loss, the target, the trend alignment, the volume confirmation, and the quality score. Without that context, you are essentially flying blind on position sizing and risk management. This is where many retail signal tools fall short: they generate alerts but do not educate the user on the logic or limitations behind them.
Over-Reliance on Automation
AI signals are a decision-support tool, not a replacement for judgment. Markets can produce conditions no model has encountered before. News events, Fed announcements, and sudden liquidity shifts can invalidate a technically valid setup in seconds. Any trader who treats signals as guaranteed outputs rather than probability-weighted ideas will eventually learn this lesson the hard way.
What a Transparent Signal Actually Looks Like
The difference between a useful signal and noise comes down to transparency. When a signal shows you its work, including its historical win rate, live performance, risk parameters, and the conditions that support or undermine the setup, you can make an informed decision. When it does not, you are just guessing with extra steps.
This is the core principle behind how Zentrix.ai’s signals dashboard was built.
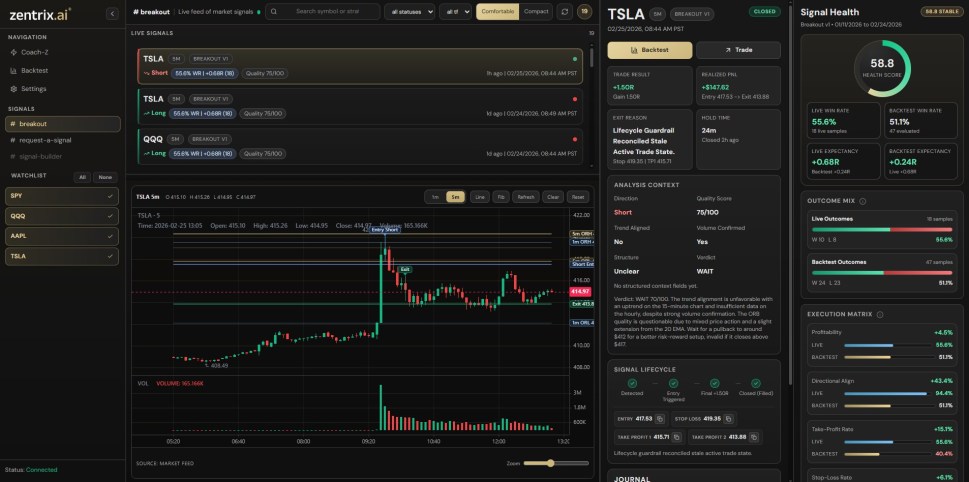
The Zentrix.ai Breakout V1 dashboard for TSLA, showing live signal data, realized PnL, signal health score, and the full execution matrix.
Zentrix MCP
Want this wired into your own AI agent?
Zentrix MCP connects Claude, GPT, and Gemini to live market data and analysis, no copy-pasting numbers into a chat window.
Join the waitlistInside the Zentrix.ai Signals Dashboard
The Zentrix signals dashboard is built around a single idea: every trade idea should be fully legible before you act on it. Here is what that looks like in practice.
Live Win Rate vs. Backtested Win Rate, Side by Side
Most platforms show you one or the other. Zentrix shows both simultaneously. In the TSLA Breakout V1 example above, the live win rate sits at 55.6% across 18 live samples, while the backtested win rate is 51.1% across 47 evaluated samples. Seeing these figures together gives you an immediate read on whether the signal is performing in line with its historical behavior, or whether something has shifted.
Signal Health Score
Each signal carries a health score, rated out of 100, that reflects the overall quality and reliability of recent performance. The TSLA Breakout V1 currently carries a 58.8 “Stable” rating, giving traders a quick-reference sanity check before they dig into the details.
AI Analysis Context
Rather than just generating a directional call, Zentrix layers in an AI-written analysis of the current setup. For the TSLA short signal shown, the system noted that trend alignment was unfavorable on the 15-minute chart, volume confirmation was present but price action was mixed, and it recommended waiting for a pullback to around $412 for a better risk-reward setup. That level of context is what separates a signal from a trade thesis.
Full Risk Parameters
Every signal on the dashboard includes a defined entry price, stop loss, and two take-profit levels. In the TSLA example, the entry was $417.53 with a stop at $419.35, a first target at $415.71, and a second target at $413.88. These numbers let you calculate your risk-to-reward ratio before placing a single order, which is fundamental to any disciplined trading approach.
Signal Lifecycle Tracking
The platform tracks each signal from detection through entry trigger to close. You can see exactly how a signal progressed, what the final outcome was, and why it closed, whether that was a lifecycle guardrail, a stale active trade state, or a clean hit on a take-profit level. This accountability layer is rarely seen in retail signal tools.
Execution Matrix
The execution matrix breaks down profitability, directional alignment, take-profit rate, and stop-loss rate for both live and backtested conditions. TSLA Breakout V1 shows a live directional alignment rate of 94.4%, which is notably higher than the 51.1% seen in backtesting. That kind of discrepancy is worth exploring, and the dashboard makes it visible rather than hiding it.
“The goal was never to give traders more alerts. It was to give them fewer, better ones, with enough information to act confidently or walk away.” (Zentrix.ai Product Team)
How to Use AI Signals Responsibly
Getting the most out of any signal tool comes down to a few consistent practices. Always check the live win rate against the backtested figure. Respect the defined stop loss on every trade, not most trades, every trade. Treat signal quality scores as a filter, not a guarantee. And if the AI analysis context suggests the setup is marginal, it is worth taking that seriously.
You can explore Zentrix’s backtesting tools to run your own validation on signal strategies before committing real capital. The platform also includes a Coach-Z feature for traders who want guided support in interpreting what they are seeing.
The broader research on systematic trading is clear: rule-based approaches with defined risk parameters outperform discretionary decision-making over long sample sizes, particularly for retail traders who lack the infrastructure of institutional desks. A study published via SSRN’s financial economics research found that retail traders who followed pre-defined entry and exit rules showed significantly lower drawdown variance than those who overrode systematic signals with gut judgment.
The Bottom Line
AI-powered stock signals work when they are built on solid methodology, validated against live data, and presented with enough transparency for the trader to understand what they are acting on. They do not work when they are marketed as black boxes with inflated win rates and no accountability for real-world performance.
Zentrix.ai was built around the belief that transparency is not a nice-to-have feature. It is the baseline. If you want to see how the Breakout V1 signals dashboard performs in real time, or explore the backtesting environment to stress-test a strategy, the tools are there without the guesswork.