Using AI to Analyze Candlestick Data
If you’re struggling to identify key candlestick trends, consider leveraging AI tools to do it for you. Coach Z is an AI chat agent that can access and analyze real-time stock market data, including technical indicators, public sentiment, and candlestick charts.
What Are Candlestick Patterns?
Candlestick patterns are visual representations of price movements in a specific time frame, typically shown on stock charts. These patterns provide insights into the market’s sentiment by showing the relationship between the opening, closing, high, and low prices. Traders use candlestick patterns to predict potential reversals, continuations, or periods of indecision in the market.
By memorizing common candlestick patterns, you can trade more efficiently and quickly react to sudden price movements.


Importance of Bullish and Bearish Patterns
Bullish patterns, like the Bullish Engulfing or Morning Star, signal potential upward reversals, where buyers regain control after a downtrend.
Bearish patterns, such as the Bearish Engulfing or Evening Star, indicate a possible shift from bullish to bearish sentiment, signaling a downward reversal.
Learning to recognize these patterns can help you enter or exit trades at the right time, improving your overall trading success.
How to Interpret Candlestick Patterns
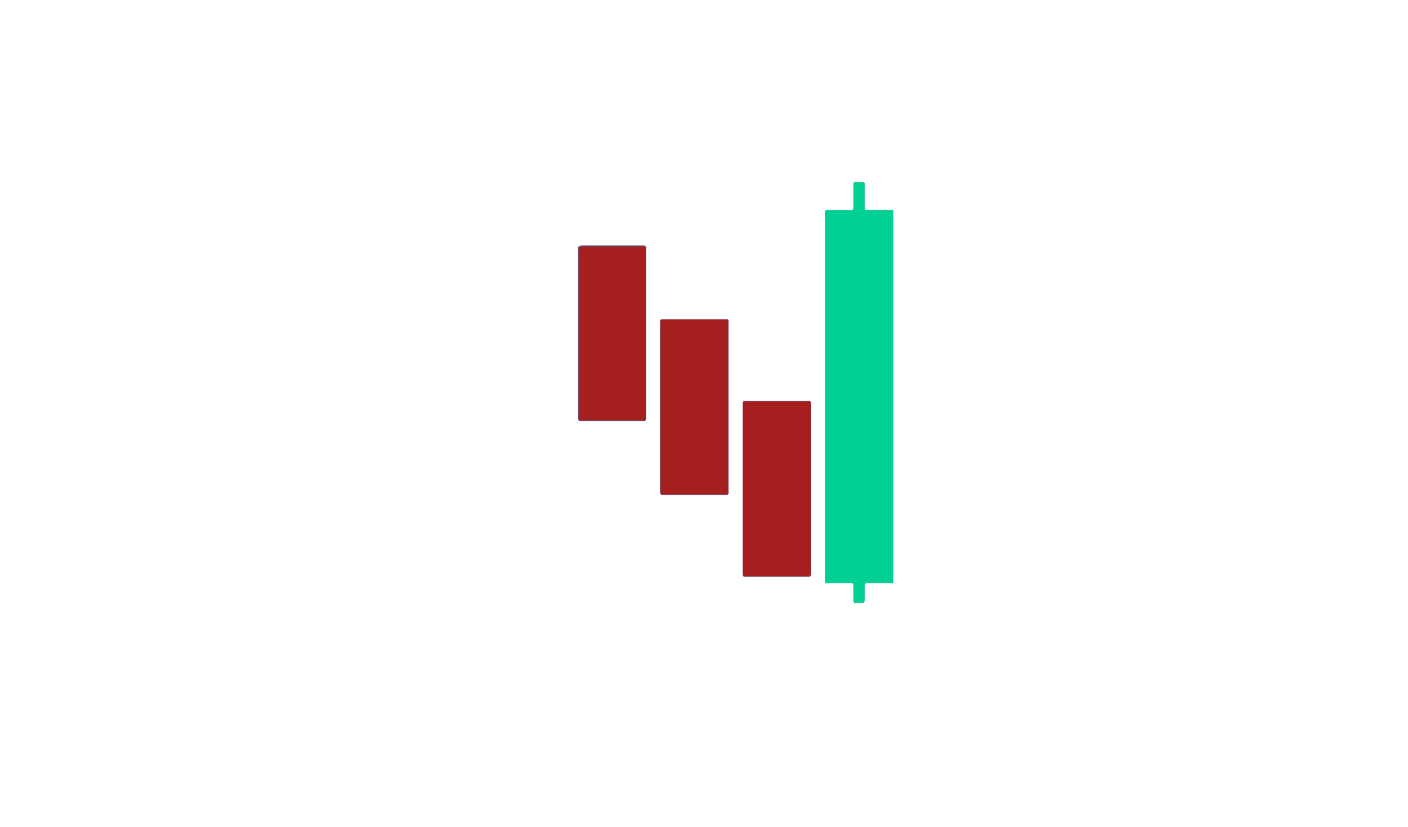
Candlestick patterns can be either single-candle formations or multi-candle structures. For example, a Shooting Star is a single bearish candle that suggests a potential downward reversal, while a Three White Soldiers pattern involves three consecutive bullish candles that indicate a strong upward trend.
By understanding both types, you can better anticipate price movements. Remember, candlestick patterns can be good indicators of a price movement, but shouldn’t be your only indicator.
