
How to Read a Candlestick Chart for Day Trading
Candlestick charts are a staple for day traders, offering crucial insights into market trends and price movements. Mastering how to read these charts can be a game-changer for making informed trading decisions. In this guide, we’ll walk through the basics of candlestick charts, how to interpret t...
- #Stocks Guide
Candlestick charts are a staple for day traders, offering crucial insights into market trends and price movements. Mastering how to read these charts can be a game-changer for making informed trading decisions. In this guide, we’ll walk through the basics of candlestick charts, how to interpret them, and their role in day trading strategies. Plus, we’ll point you to an excellent Candlestick Pattern Quiz to test your skills!
What is a Candlestick Chart?
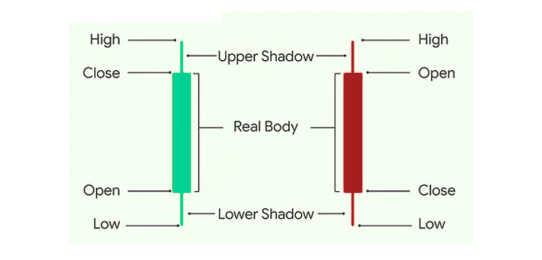
A candlestick chart is a type of financial chart used to track the price movements of an asset over a specific period. Each “candlestick” represents four key data points:
Open: The price at the start of the time frame.
Close: The price at the end of the time frame.
High: The highest price reached during the time frame.
Low: The lowest price during the time frame.
Candlesticks can show price action in different time frames, from one minute to one day, depending on how long the trader holds their position. Day traders usually look at shorter time frames, such as 1-minute or 5-minute charts.
Components of a Candlestick
Each candlestick consists of a body and wicks (or shadows):
The body: This shows the price range between the open and close. If the close is higher than the open, the body is typically green (bullish). If the close is lower than the open, it’s red (bearish).
The wicks: The thin lines above and below the body show the highest and lowest prices during the time period.
The interpretation of the candle’s body and wicks reveals market sentiment, indicating if buyers or sellers are in control.
Key Candlestick Patterns for Day Trading
Understanding basic candlestick patterns can give you an edge in day trading. Some patterns signal potential reversals or continuations in price direction. Here are a few patterns you should know:
1. Doji
A Doji candlestick forms when the open and close prices are very close or equal, indicating indecision in the market. It suggests that neither the buyers nor sellers are in full control.
2. Engulfing Patterns
Bullish Engulfing: A green candle completely engulfs the previous red candle, indicating a potential reversal from bearish to bullish.
Bearish Engulfing: A red candle engulfs the prior green candle, signaling a bearish reversal.
Zentrix MCP
Want this wired into your own AI agent?
Zentrix MCP connects Claude, GPT, and Gemini to live market data and analysis, no copy-pasting numbers into a chat window.
Join the waitlist3. Hammer and Hanging Man
Hammer: A bullish reversal pattern. It forms when the price drops significantly but recovers, closing near the open, indicating buying pressure.
Hanging Man: A bearish version of the hammer, which suggests a possible price decline after an upward trend.
4. Morning Star and Evening Star
Morning Star: A bullish reversal pattern consisting of three candles, signaling the end of a downtrend.
Evening Star: The bearish counterpart, showing the possible start of a downtrend after a bullish move.
These are just a few examples of candlestick patterns, but they are crucial to recognize as they provide actionable insights for day traders.
How to Use Candlestick Charts in Day Trading
For day traders, candlestick charts are vital for identifying opportunities and understanding market momentum. Here’s how you can use them in your strategy:
Identify Trend Reversals: Patterns like the hammer or engulfing can indicate when a current trend is about to reverse, helping you decide whether to buy or sell.
Gauge Market Sentiment: Long wicks or shadows can show high volatility, while small candles can indicate consolidation or a lack of momentum.
Time Entries and Exits: Candlestick patterns can guide when to enter or exit trades. For example, after spotting a bullish engulfing pattern, you might go long (buy) with the expectation of upward momentum.
Why Take Our Candlestick Quiz?
If you want to sharpen your skills, taking our Candlestick Pattern Quiz is a great way to reinforce what you’ve learned. It’s designed to test your knowledge of various patterns, helping you gain more confidence in reading charts. Whether you’re new to day trading or an experienced trader looking to refresh your skills, this quiz will enhance your ability to spot profitable setups.
Final Thoughts
Learning how to read candlestick charts is a must for any serious day trader. These charts help you understand price action, spot trends, and make informed decisions in real-time. Practice is key, and the more you familiarize yourself with these patterns, the better you’ll become at anticipating market movements.