
What is a Candlestick Chart in the Stock Market?
In the world of stock trading, mastering technical analysis is essential for making informed decisions. One of the most important tools traders use to understand price action is the candlestick chart. But what exactly is a candlestick chart, and how can it help traders spot trends in the market?...
- #Stocks Guide
In the world of stock trading, mastering technical analysis is essential for making informed decisions. One of the most important tools traders use to understand price action is the candlestick chart. But what exactly is a candlestick chart, and how can it help traders spot trends in the market?
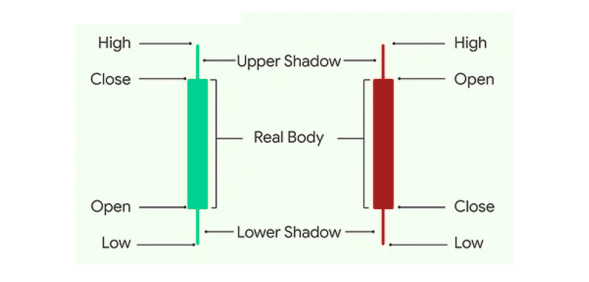
Understanding the Candlestick Chart
A candlestick chart is a type of financial chart used to represent the price movements of an asset over a specific period. This chart type originated in Japan over 100 years ago and has become one of the most popular tools for stock market analysis today.
Each candlestick provides four crucial pieces of information about an asset’s price:
Open: The price at the start of the time period.
Close: The price at the end of the time period.
High: The highest price reached during the period.
Low: The lowest price reached during the period.
The candlestick has two parts: the body and the wicks (or shadows). The body shows the price range between the open and close, while the wicks extend to show the high and low prices. If the close price is higher than the open, the body is typically green (or white), indicating bullish sentiment. If the close is lower than the open, the body is red (or black), signaling bearish sentiment.
Why Are Candlestick Charts Important?
Candlestick charts are vital because they visually represent market sentiment in an easily digestible format. With just a glance, traders can assess whether bulls or bears dominated the market during a particular session.
More importantly, traders use candlestick patterns to predict potential future price movements. Patterns like the Doji, Hammer, or Engulfing can give clues about upcoming bullish or bearish trends, helping traders make more informed decisions.
Popular Candlestick Patterns
Here are three common candlestick patterns that traders often watch for:
Doji: This occurs when the open and close prices are almost the same, suggesting indecision in the market. A Doji can signal a potential reversal if it appears after a strong trend.
Hammer: A hammer forms when the price dips significantly lower during the session but recovers to close near the open. This pattern often signals a bullish reversal.
Engulfing Pattern: In this two-candle pattern, the second candle’s body completely engulfs the first. A bullish engulfing pattern indicates that buyers have taken control, while a bearish engulfing pattern suggests sellers are dominating.
Zentrix MCP
Want this wired into your own AI agent?
Zentrix MCP connects Claude, GPT, and Gemini to live market data and analysis, no copy-pasting numbers into a chat window.
Join the waitlistHow Candlestick Charts Can Improve Your Trading
For traders who are serious about making smart decisions, learning to interpret candlestick patterns can be a game-changer. By combining candlestick analysis with other technical indicators like RSI (Relative Strength Index) or MACD (Moving Average Convergence Divergence), you can gain a deeper understanding of market trends and potential entry or exit points.
If you’re eager to test your knowledge and sharpen your skills, try Zentrix’s Candlestick Pattern Quiz. It’s a fun, interactive way to see how well you can identify key patterns and apply them to real-world scenarios.
Final Thoughts
Whether you’re new to trading or a seasoned pro, candlestick charts are an essential part of the toolkit. They provide valuable insights into market psychology and can significantly improve your ability to predict price movements. Many traders leverage candlestick patterns for making day trades, swing trades, and even long-term investments. When updating the candlestick chart’s time frames to reflect the type of trade you’re making, its patterns can reveal crucial insights. Best of luck!